推薦的系統圖網站:https://www.pinterest.com/atermath/ux-experience-maps/
In 2011, the newly appointed CEO of Nokia, Stephen Elop, wrote:
The battle of devices has now become a war of ecosystems, where ecosystems include not only the hardware and software of the device, but developers, applications, ecommerce, advertising, search… location-based services, unified communications and many other things. Our competitors aren’t taking our market-share with devices; they are taking our market share with an entire ecosystem. This means we’re going to have to decide how we either build, catalyse or join an ecosystem.”
An ecosystem is the term given to a set of products, services, and people that function together in a symbiotic way. As an interaction designer working at a consultancy, I often meet clients who want to integrate all sorts of functionality into their digital solutions—email, Facebook, SMS—without really considering if that inclusion will actually add value for their users. Rather than unilaterally connecting all possible digital channels and launching a “family” of related products and services, designers need to determine ways in which ecosystems can act together in service of their client’s business goals.
經由 the newly appointed CEO of Nokia, Stephen Elop所說的,過去硬體的戰役至現在網路服務設計,建構、加入使其更完整的生態系統,從服務、共生,作為互動設計師的工作,從生活的數位電子儀器、媒體都是設計人員可以做為目標,成就很好的服務。
設計師透過明確的數據報告,回顧這些流程的生態系統,第一部分:如何創建一個生態系統的優化,有效的加入工具(元素)。

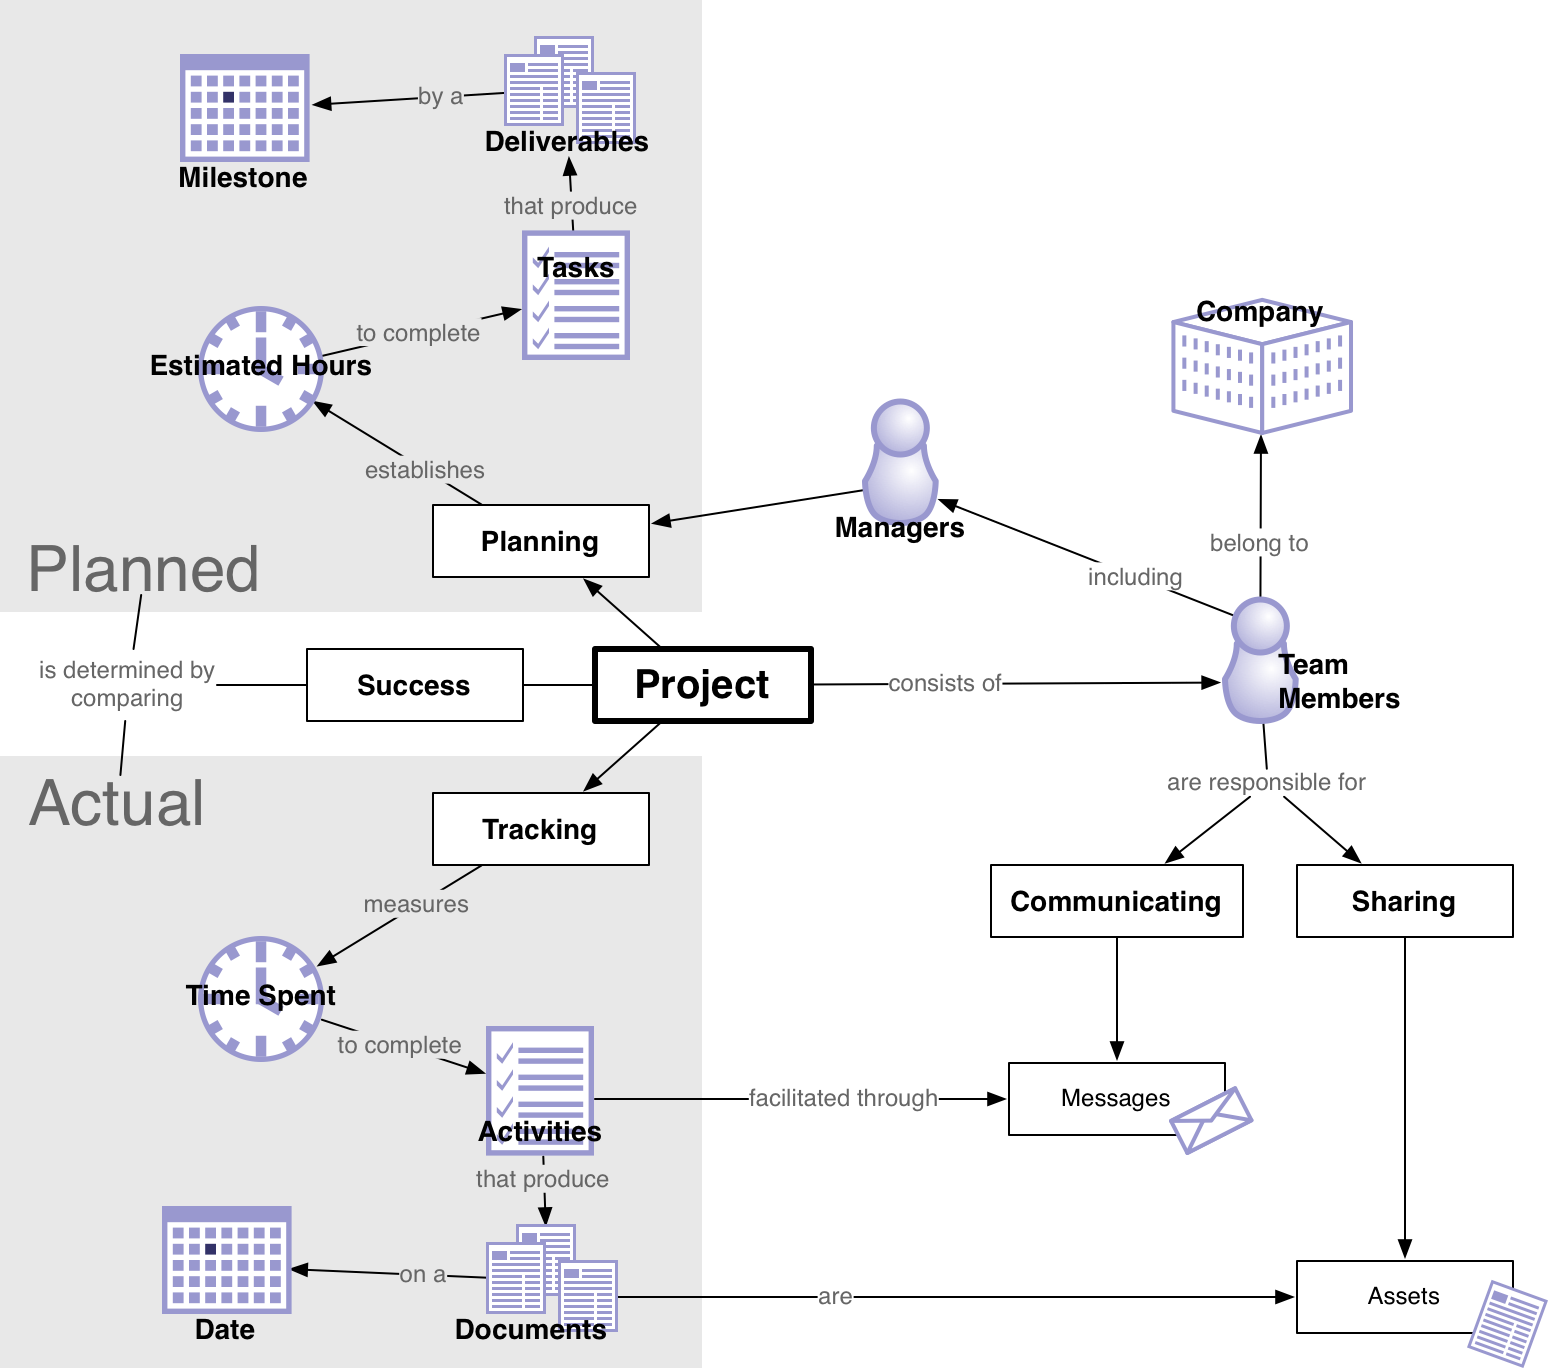
圖1:使用者資訊管理應用流程圖
(來源:http://uxmag.com/articles/design-for-a-thriving-ux-ecosystem)
The Nerdery:
A UX ecosystem is a set of interdependent relationships that emerge between components within an information environment. These components include:
- People who are managing information, sharing data with one another, and collaboratively building knowledge for themselves or an organization.
- The goals and practices of these people, both as individuals and as collaborators.
- The digital and analog technologies that they use to share information and interact with one another in meaningful ways.
- The information that these people share and value for their individual and collaborative purposes.
一個生態系統地圖的思維可以利用的圖形表示, HCI / GUI / UI / UX 等領域最常使用的服務藍圖、體驗地圖、概念圖,從這些不同的圖進行了解優化,幫助設計師發想。

來源:PRORosenfeld Media 生態系統圖(https://www.flickr.com/photos/rosenfeldmedia/8461138803/in/set-72157632731881073 )

來源:Andy Polaine, Roman Aebersold, Robert Bossart and Andrea Mettler 服務藍圖(http://www.servicedesigntools.org/sites/default/files/res_images/BLUEPRINT_03.jpg )

來源:The Journey Model 體驗地圖 (http://adaptivepath.org/ideas/the-anatomy-of-an-experience-map/)
(https://articles.uie.com/concept_models/)
資料來源:
1.Design for a Thriving UX Ecosystem
http://uxmag.com/articles/design-for-a-thriving-ux-ecosystem
2.Designing Digital Strategies, Part 1: Cartography
http://www.uxbooth.com/articles/designing-digital-strategies-part-1-cartography/
3.The Anatomy of an Experience Map
http://adaptivepath.org/ideas/the-anatomy-of-an-experience-map/
沒有留言:
張貼留言